Generating a Measurement-based Transfer Function
for TAMAGO Using HARKTOOL5
Table of Contents
1. Overview
2. Converting TSP response to Impulse response
3. Creating Microphone Array Positions XML File
4. Creating Sound Source Positions XML File
5. Generating Transfer Function
1. Overview
This manual will focus on using the measurement-based transfer function generation. Generating transfer functions from actual measurements using TSP (Time Stretched Pulse) can be divided to two parts: (1) playing the TSP signal and recording the TSP response, and (2) calculating the impulse responses from TSP responses. This manual will use the TAMAGO device, which produces an unsynchronized recording. This manual will assume that the TSP Responses have already been recorded using the Recording TSP response steps found in the TAMAGO manual. After recording, the impulse response for each TSP signal can be calculated by adding each TSP and calculating the converse of the inverse TSP signal with the added TSP. This manual will detail the steps on generating a transfer function using HARKTOOL5 after recording TSP Responses.
2. Converting TSP response to Impulse response
The recording generated by the TAMAGO is an unsynchronized recording. For unsynchronized recording the Transfer Function Estimation Using Complex Regression Model (formally known as FD transform) must be used to generate the transfer function. The FD transform algorithm needs the Impulse response to generate the transfer
function, so the recorded TSP responses need to be converted to Impulse responses.
To use the MouthTSP tool in HARKTOOL5, the "Use Mouth TSP Record File" option in the TF Calculation Type shown in Figure 1 should be selected. This option will be further discussed in 5. Generating Transfer Function.
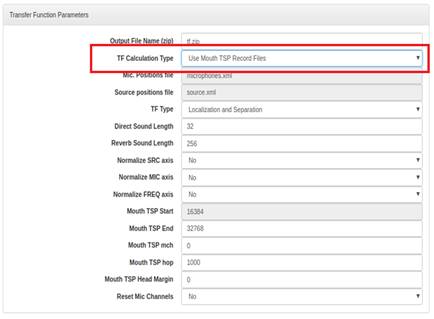
Figure 1. Mouth TSP TF Calculation Type
3. Creating Microphone Array Positions XML File
- Run HARKTOOL5-GUI. See https://www.hark.jp/document/2.4.0/packages/harktool5-gui-en/harktool5-gui.html#id1 on how to run the HARKTOOL5- GUI service.
- Open a web browser (Google Chrome is recommended) and enter http://localhost:3001.
HARKTOOL5-GUI will open as shown in Figure 2.
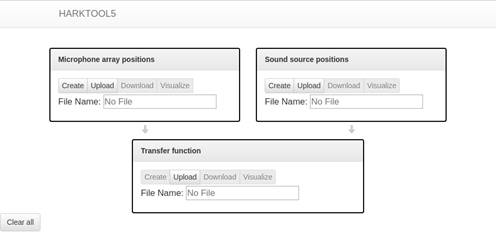
Figure 2. Opened HARKTOOL5-GUI
- Under the Microphone array positions panel, click the "Create" button as shown in Figure 3.
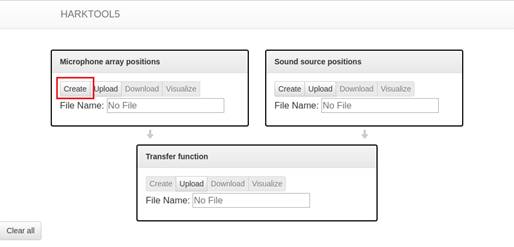
Figure 3. "Create" button for microphone array positions
- In the "Create Microphone Array Positions" page, choose the Circle template (Figure 4). Note that for the measurement-based transfer function generation, the positions of each microphone in a microphone array do not need to be correctly specified whereas the number of microphones in a microphone array needs to be correct. Please refer to the separate base manual for generating a transfer function, How to Generate a Transfer Function using HARKTOOL5 for the further information.
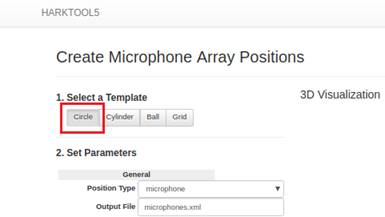
Figure 4. Circle template button for microphone array positions
- Leave the value in Output File parameter to its default value "microphones.xml" (Figure 5). This parameter can be edited to use the desired output filename for the microphone array positions xml.
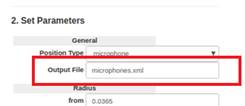
Figure 5. Output File parameter for microphone array positions
- Edit the parameter values under the Azimuth section (Figure 6) to:
- from = 0
- to = 359
- interval = 45
The parameter values should be adjusted to match the number of microphones of the recording device that was used. In the Recording TSP Response using TAMAGO manual manual, the TAMAGO has 8 microphones. The parameter value above configures the template to position a microphone at every 45 degrees from 0 to 359 degrees and this results to having 8 microphones.
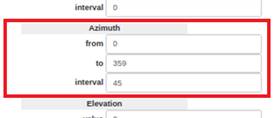
Figure 6. Azimuth section for microphone array positions
- Leave all other parameters to their default values. Figure 7 shows the values of the parameters after setting for the steps from 5 to 7.
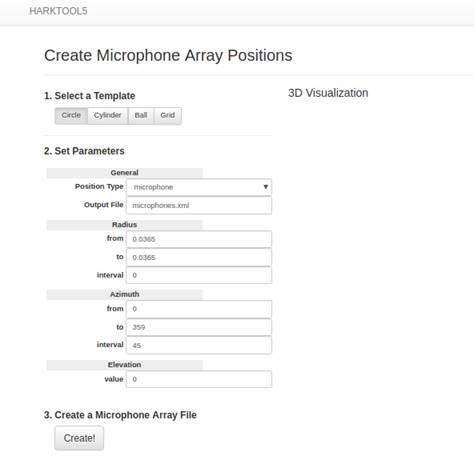
Figure 7. Values for the microphone array positions parameters
- Click the "Create!" Button (Figure 8) near the bottom of the page.
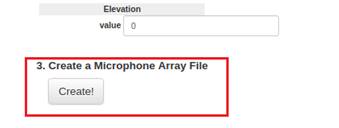
Figure 8. "Create!" button for microphone array positions
- After a successful generation, check the 3D Visualization on the right side of the page. Figure 9 shows the expected output for the 3D visualization using the parameters values shown in Figure 7. If the visualization shows the correct number of microphones (represented by red dots), click the link bordered in green found at the bottom part to go back to the top page.
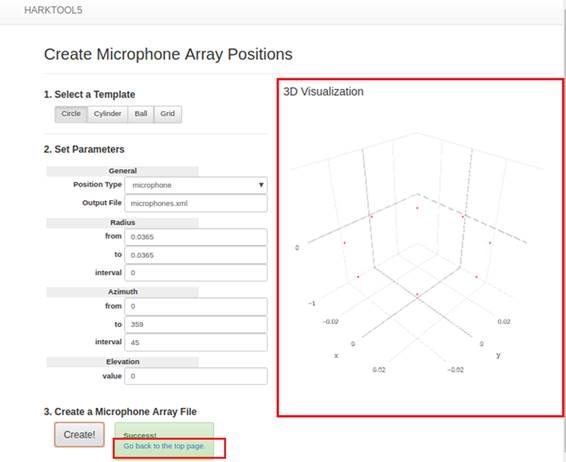
Figure 9. 3D Visualization output of the microphone array positions and link to return the top page
- In the top page, the filename of the successfully generated microphone array positions xml should be displayed in the File Name text box under the microphone array positions panel (Figure 10).
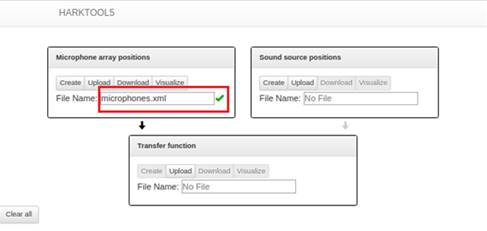
Figure 10. Filename of successfully generated microphone array positions in the top page
- The generated microphone array positions xml can be downloaded. To do this, click on the "Download" button (Figure 11) in the microphone array positions panel. The downloaded microphone array positions xml can be used to upload the same configuration instead of creating the same microphone array positions xml again.
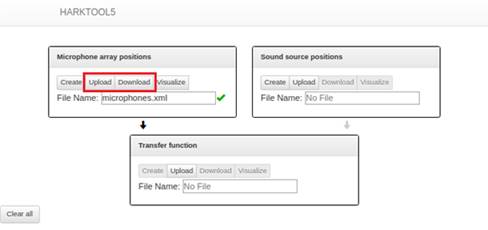
Figure 11. "Download" and "Upload" button for microphone array positions
- To see the visualization or modify the values of the generated microphone array positions xml, click the "Visualize" button (Figure 12). Figure 13 shows the page that will be displayed after the "Visualize" button is pressed.
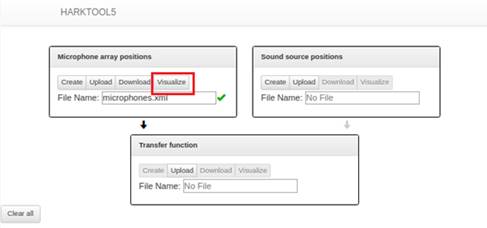
Figure 12. "Visualize" button for microphone array positions
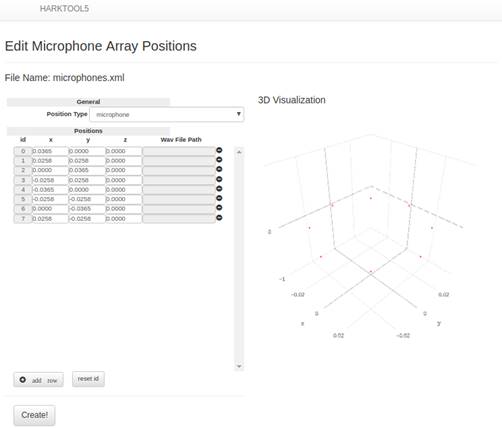
Figure 13 Visualization page for microphone array positions
- Open the HARKTOOL5-GUI. Please refer to steps 1 and 2 of 3. Creating Microphone Array Positions XML File.
- Under the sound source positions panel, click the "Create" button (Figure 14).
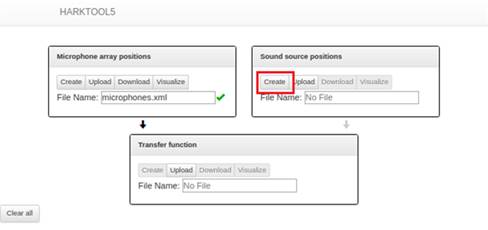
Figure 14. "Create" button for sound source positions
- Select the Circle template (Figure 15) for the sound source positions. The template should match the layout used in the recording set-up. In the Recording TSP Response using TAMAGO manual manual, the layout is circular, so the Circle template will be used.
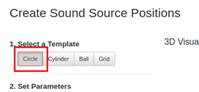
Figure 15. Circle template button for sound source positions
- Set Position type to "tsp" (Figure 16). The appropriate type for the wav file used should be selected. In the Recording TSP Response using TAMAGO manual manual, the TSP signal was used, so the "tsp" setting is chosen.
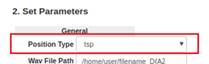
Figure 16. Position Type parameter
- Edit the "Wav File Path" parameter to point to the correct location of the wav files and the expected filename of the wav files. It is expected that there will be multiple wav files so the "Wav File Path" parameter can use a special pattern of {tag:format} in the filename parameter to automatically change the filename for each wav file based on the corresponding position.
Table 1 shows a list of the tags and its respective units of measurement.
Table 1. Name Templates and UnitsTag Unit RADIUS m ELEVATION deg AZIMUTH deg X_AXIS mm Y_AXIS mm Z_AXIS mm HEIGHT mm
The format after the tag follows the printf format for Decimal floating point, lowercase (%f). See http://www.cplusplus.com/reference/cstdio/printf/ for more information on the printf format for Decimal floating point, lowercase (%f). In the Recording TSP Response using TAMAGO manual manual, the recording layout is circular with a radius of 1 meter, the azimuth interval is for every 30 degrees from 0 - 330 degrees, and the speaker and microphone are on the same elevation. The files are named based on their Azimuth angle as shown in Table 2.
Table 2. Azimuth Filename ExamplesLocation of the speaker where TSP was played Example Filename 0° sep_000.wav 30° sep_030.wav 60° sep_060.wav ... ... 330° sep_330.wav
Assuming the files are in the /home/user/tamago_rec,
the "Wav File Path" will be: /home/user/tamago_rec/sep_{AZIMUTH:%03.0f}.wav (Figure 17)
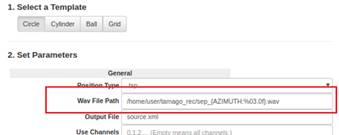
Figure 17. Wav File Path parameter
- Leave the value in Output File parameter to its default value "source.xml" (Figure 18). The parameter value can be edited to use the desired output filename for the sound source positions xml.
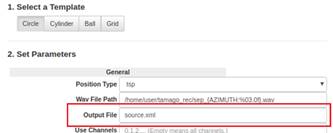
Figure 18. Output File parameter for sound source positions
- Edit the values of the parameters in the Radius, Azimuth and Elevation sections to:
- Radius Section: from = 1, to = 1 and Interval = 0
- Azimuth Section: from = 0, to = 359 and Interval = 30
- Elevation Section: value = 0
The position parameters should match the layout of the sound source location done for the TSP recording. The values above match the set-up in the separate manual, Recording TSP Response using TAMAGO manual: the recording layout is circular with a radius of 1 meter, the azimuth interval is for every 30 degrees from 0 - 330 degrees, and the speaker and microphone are on the same elevation.
Figure 19 shows the values for the parameters in the Radius, Azimuth and Elevation sections.
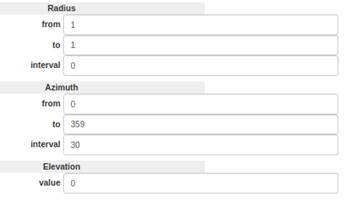
Figure 19. Values for the parameters in the Radius, Azimuth and Elevation sections
- Click the "Create!" Button (Figure 20) at the bottom of the sound source positions page.
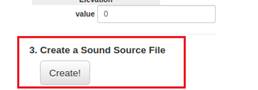
Figure 20. "Create!" button for sound source positions
- After a successful generation, check the 3D Visualization on the right side of the page. Figure 21 shows the expected output for the 3D visualization using the parameters values set in steps 3 - 7. If the visualization shows the correct positions and number of sound sources (represented by red dots), click the link bordered in green found near the bottom part of the page to go back to the top page.
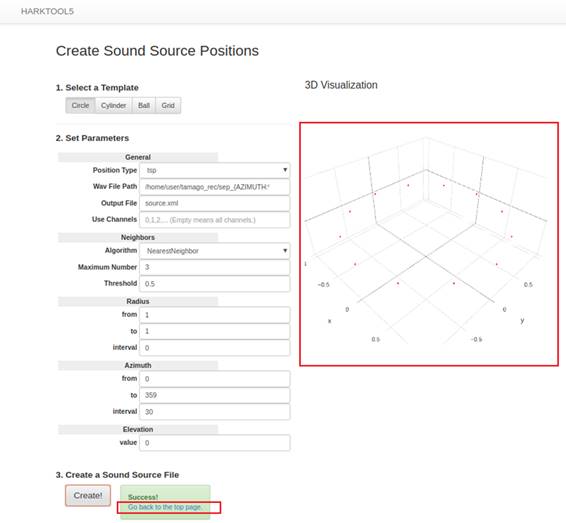
Figure 21. 3D Visualization output of the sound source positions and link to return the top page
- In the top page, the filename of the successfully generated sound source positions xml should be displayed in the File Name text box under the sound source positions panel (Figure 22).
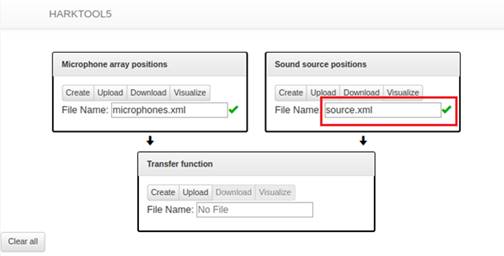
Figure 22. Filename of successfully generated sound source positions xml in the top page
- Under the sound source positions panel, click the "Visualize" button (Figure 23).
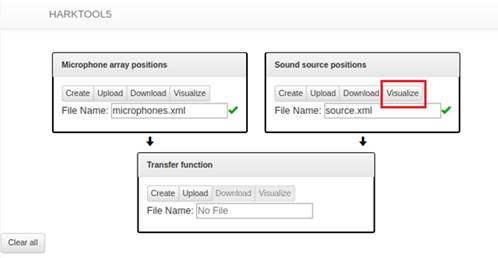
Figure 23. "Visualize" button for sound source positions
- In the new page, check the positions and Wav File Path if everything is as expected. One common cause for error during transfer function generation is that the file paths are not correct. Figure 24 highlights where the file paths can be checked and edited. The visualization in the right part of Figure 24 can also be used to check the positions.
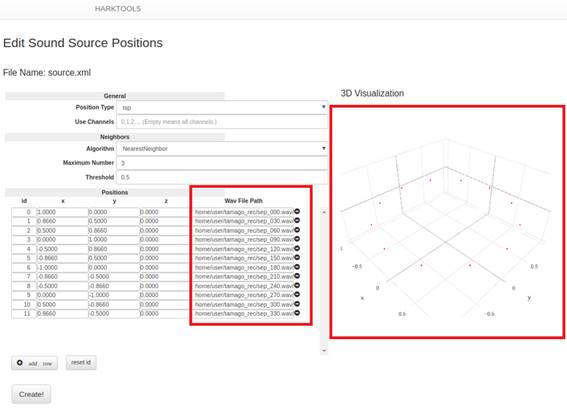
Figure 24. File path values and 3D visualization in sound source positions visualize page
- Edit the values as needed. If the values are edited, click the "Create!" button to apply the changes made.
- If the positions and filenames are not correct, go back to the top of this Section.
- The generated sound source positions xml can be downloaded. To do this, click the "Download" button (Figure 25) in the sound source positions panel. The downloaded sound source positions xml can be used to upload the same configuration instead of creating the same sound source positions xml again.
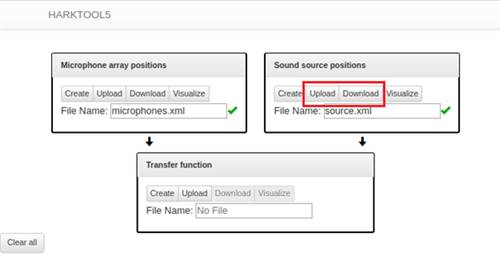
Figure 25. "Download" and "Upload" button for sound source positions
- Open the HARKTOOL5-GUI. Please refer to steps 1 and 2 of 3. Creating Microphone Array Positions XML File.
- Prepare the microphone array positions xml file and the sound source positions xml file. If the two files are ready for transfer function generation, the panels for microphone array positions and sound source positions should show a check mark as shown in Figure 26. If the files are not ready, use the steps in 3. Creating Microphone Array Positions XML File or 4. Creating Sound Source Positions XML File to prepare the files. The files can also be uploaded if the files were previously downloaded as shown in Figure 11 and Figure 25.
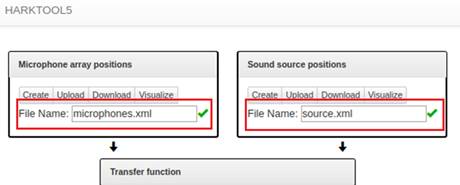
Figure 26. Microphone array positions xml file and sound source positions xml file ready for transfer function generation, as indicated by the check marks
- With the microphone array positions xml file and the sound source positions xml file ready, click the "Create" button (Figure 27) under the transfer function panel.
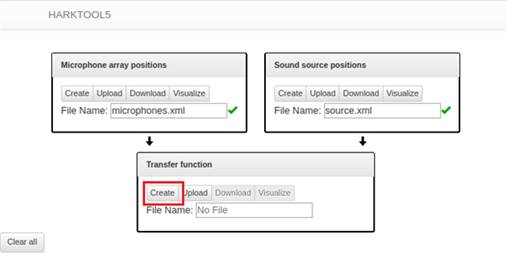
Figure 27. "Create" button for transfer function
- Leave the values for the Config (General Parameters) to their default values. The default values are shown in Figure 28. A short description of each parameter is available in https://www.hark.jp/document/2.4.0/packages/harktool5-gui-en/harktool5-gui.html#create-tf-label>.
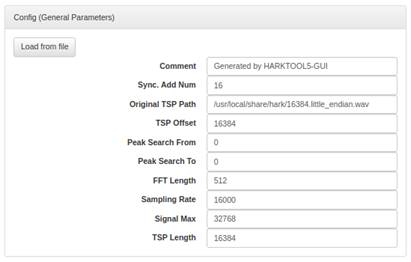
Figure 28. Default values for Config (General Parameters)
- Leave the value for the Output File Name (zip) parameter to the default value "tf.zip" (Figure 29). The parameter value can be edited to use the desired output filename for the transfer function zip file.
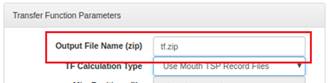
Figure 29. Output File Name (zip) parameter
- Select the "Use Mouth TSP Record Files" for the TF Calculation Type (Figure 30). The value for TF Calculation Type will depend on the algorithm and wav files to be used. For measurement-based transfer functions, it will either be "Use TSP Record Files" for synchronized recording or "Use Mouth TSP Record Files" for unsynchronized recording. The TSP Responses have been recorded using the steps in the Recording TSP Response using TAMAGO manual manual, which produces an unsynchronized recording, so "Use Mouth TSP Record Files" is chosen. A short description of each option is available in https://www.hark.jp/document/2.4.0/packages/harktool5-gui-en/harktool5-gui.html#create-tf-label
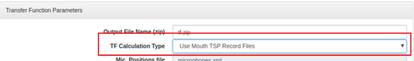
Figure 30. Use Mouth TSP Record Files" selected in TF Calculation Type
- Leave the other values for the parameters in the Transfer Function Parameters section to their default values. The default values of the other parameters are shown in Figure 31.
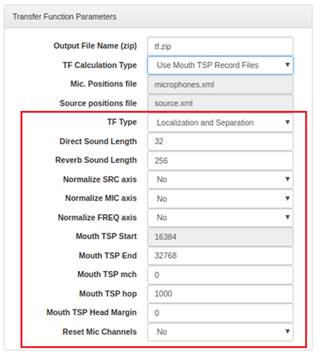
Figure 31. Default value for the other Transfer Function Parameters
- Click the "Create!" Button (Figure 32) found near the bottom left part of the page.
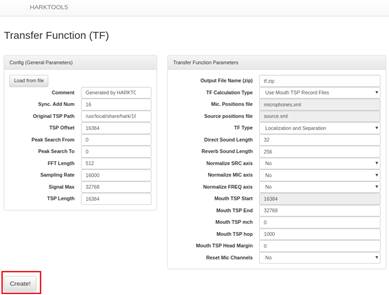
Figure 32."Create!" Button for transfer function
- The status of the transfer function generation will be displayed in the bottom left part of the page. Figure 33 shows how a successful status for the transfer function generation will look like. Figure 34 shows how an error status caused by setting an incorrect "Wav File Path" in step 5 of 4. Creating Sound Source Positions XML File will look like in the transfer function generation.
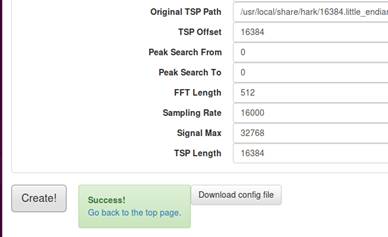
Figure 33. Successful status in transfer function generation
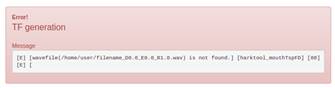
Figure 34. Error status for incorrect TSP path in transfer function generation
- Once successful with the creation, the Localization and Separation transfer function will be generated and packaged in a zip file. Click the link bordered in green (Figure 35) found near the bottom part of the page to go back to the top page.
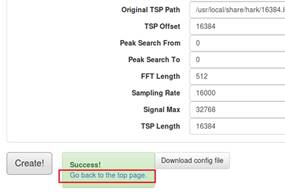
Figure 35. Link to return the top page for transfer function
- In the top page, the successfully generated localization and separation transfer functions zip file should be displayed in the File Name text box under the transfer function panel (Figure 36).
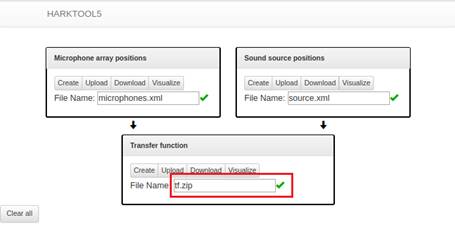
Figure 36. Filename of successfully generated transfer function zip file in the top page
- The created transfer function file can be confirmed in 3D graph by clicking the "Visualize" button (Figure 37) under the transfer function panel.
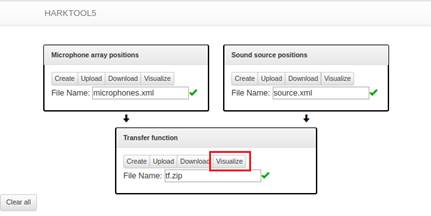
Figure 37. "Visualize" button for transfer function
- The TF visualize feature can graph either the Localization transfer function or Separation transfer function. To confirm the Localization transfer function, set TF type to "Localization", set Domain to "Time domain" and set Z Axis to "Amplitude" as shown in Figure 38.
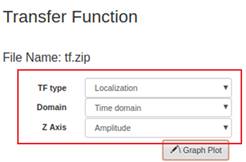
Figure 38. Parameter values for TF Type, Domain and Z Axis to confirm the Localization transfer function
- Click the "Graph Plot" button (Figure 39). For the TSP responses recorded using the steps in the Recording TSP Response using TAMAGO manual manual, the Time domain graph of the Localization transfer function with Amplitude as the Z-axis should look something like the graph in Figure 39.
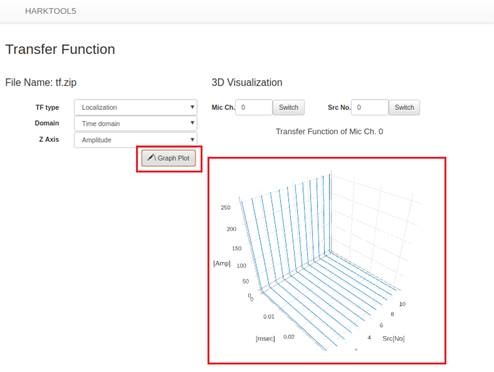
Figure 39. Graph Plot button and time domain graph for the generated localization transfer function with amplitude as the z-axis
- To confirm the Separation transfer function, set TF type to "Separation", set Domain to "Time domain" and set Z Axis to "Amplitude" as shown in Figure 40.
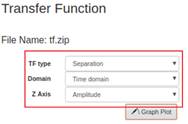
Figure 40. Parameter values for TF Type, Domain and Z Axis to confirm the Separation transfer function
- Click the "Graph Plot" button (Figure 41). For the TSP responses recorded using the steps in the Recording TSP Response using TAMAGO manual manual, the Time domain graph of the Separation transfer function with Amplitude as the Z-axis should look something like the graph in Figure 41.
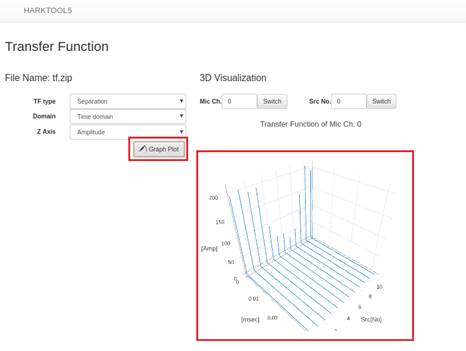
Figure 41. "Graph Plot" button and time domain graph for the generated separation transfer function with amplitude as the z-axis
- To download the generated transfer function, click Download on the transfer function panel shown in Figure 42. The downloaded transfer function can be used in HARK Designer for sound source localization or sound source separation.
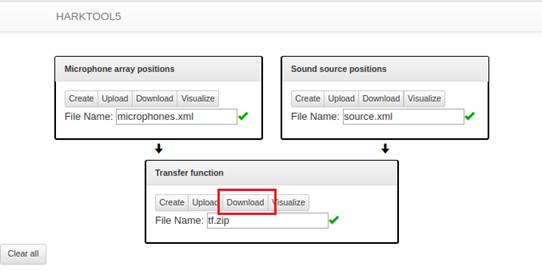
Figure 42. "Download" button for transfer function
4. Creating Sound Source Positions XML File
5. Generating Transfer Function
---- End-----