Recording TSP Response using TAMAGO
Table of Contents
1. Overview
2. Equipment
3. Sound Source Position Setting
4. Create a Network file
5. Recording Procedure
1. Overview
This manual covers the procedures of Recording TSP Response in unsynchronized recording using an egg-shaped microphone array, TAMAGO.
2. Equipment
This section provides information on equipment used in this manual and how to connect the recording devices.
- Microphone Array
- Number of channels: 8 channels
- Microphone layout: A circular layout with a 36.5 mm radius and 45 degree intervals (Figure1)
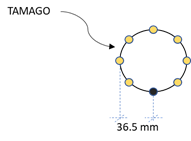
Figure 1. Microphone layout
A/D: TAMAGO
- Product Information:http://www.sifi.co.jp/system/modules/pico/index.php?content_id=39
- Device type: USB
- Recording type: Unsynchronized playing and recording
- Software
- Robot Audition Open Source Software HARK version 2.4.0.2
- Digital Audio Editor: Audacity
- Other Equipment
- Speaker for playing back TSP signals
- Additional stationery tools
- Tape for marking
- Ruler/Measuring Tape/Protractor for measuring
- Wiring Diagram
Figure 2 shows how to setup the equipment when using TAMAGO.
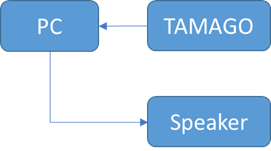
Figure 2. Wiring Diagram for the Equipment Setup
- Connect TAMAGO to PC via USB port
- Connect the Speaker into PC's 3.5mm Jack
- 2 PCs can be used in this setup (optional), 1 connected to Mic and 1 connected to Speaker
3. Sound Source Position Setting
This section provides directions how to set up the recording environment according to the following assumptions:
- Number of sound source positions: 12
- Layout: Circular with a radius of 1 meter
- Elevation to the microphone positions: 0 degree
- Find a room to perform TSP recording. The following recording conditions are preferable:
- Noise should be as low as possible.
- The room environment should be as similar as possible to where the transfer function is to be used.
- With a piece of tape or a sticky paper, mark a suitable position where the microphone array will be placed. For a circular setup, choosing the center of the room as illustrated in Figure 3 will provide enough space for marking all the positions. Place the microphone array on the marked position.
- As shown in Figure 4, draw a circle with a radius of 1 meter around the microphone array. Choose a starting point and mark it as 0°. Put a mark on every 30° interval in a counter clockwise direction from the starting point using a tape or a sticky paper. Measure the angles using a protractor. Write the angle value on the maker.
- Place the speaker on the starting point marked as 0° as shown in Figure 4.
- Set the speaker at the same height with the microphone array as shown in Figure 5.
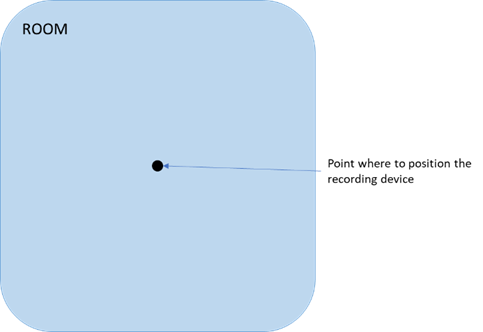
Figure 3. Recording Room [Top View]
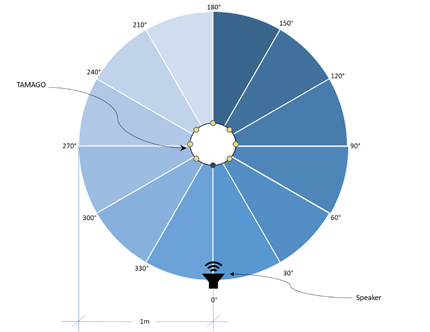
Figure 4. Recording Environment Set Up [Top View]
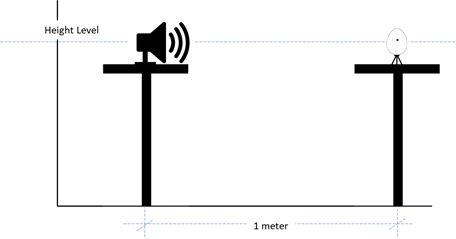
Figure 5. Recording Environment Set Up [Side View]
4. Create a Network file
This section provides directions on how to create a HARK network file using HARK-Designer.
- Launch HARK Designer
- Windows: Double click the HARK Designer icon (Figure 6) on Desktop.
Figure 6. HARK Designer Icon
- Ubuntu: Open Terminal and run the following command:
$ hark_designer
Note: For HARK 2.4.0+ Firefox users, please use the following command:
$ hark_designer f - Once Hark Designer is launched, click the '+' icon next to the MAIN (subnet) sheet in the initial screen (Figure 7) to add a new sheet.
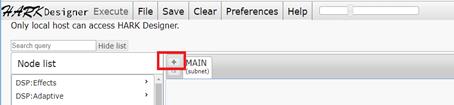
Figure 7. The '+' icon to add a new sheet - Name the new sheet LOOP0 and set its type to Iterator in the settings dialog box as shown in Figure 8a.
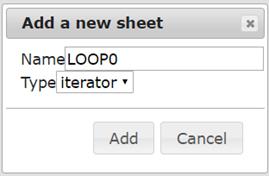
Figure 8a. "Add a new sheet" Dialog Box
Note that any name can be given to the new sheet and any newly created sheet's name will appear in the node list in the Dynamic category as shown in Figure 8b.
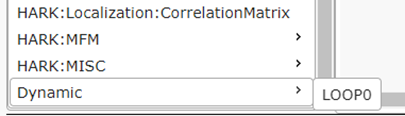
Figure 8b. "Dynamic" in the bottom of the Node List - Click LOOP0 sheet tab and create a subnetwork as shown in Figure 9.
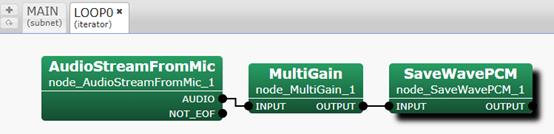
Figure 9. The subnetwork to be created in LOOP0
- Add the following three nodes in the LOOP0 sheet; AudioStreamFromMic, MultiGain and SaveWavePCM. Thess nodes are listed in the Node list or can also be found by typing the node name in the search field located above the node list (Figure 10). To add a node, click
the node once it is displayed in the Node list.
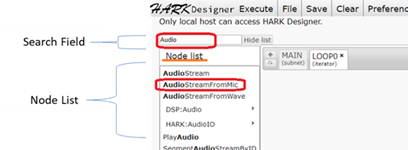
Figure 10. Node List and Search Field - Connect AudioSteamFromMic and MultiGain shown in Figure 11 by dragging AudioStreamFromMic's output terminal named AUDIO to MultiGain's input named INPUT.
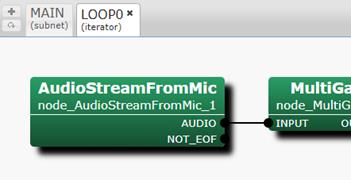
Figure 11. Connect AudioStreamFromMic and MultiGain
- Right click on AudioStreamFromMic's output terminal named NOT_EOF and select "Set as Condition" in the setting options as shown in Figure 12.
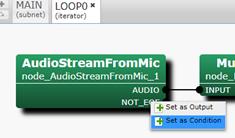
Figure 12. The setting options of NOT_EOF - Double click on AudioStreamFromMic and set the parameters in the dialog box as indicated in Figure 13 except for DEVICETYPE.
Please note that the value for DEVICETYPE is different depending on the operating system.
- Windows: string, DS
- Ubuntu: string, ALSA
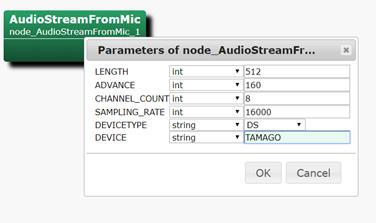
Figure 13. The values to set for AudioStreamFromMic parameters
Once the parameters are set properly, click OK. - Connect MultiGain's output terminal named OUTPUT to SaveWavePCM's INPUT as shown in Figure 14, MultiGain is an optional node that amplifies the inputs power.
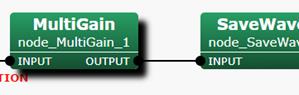
Figure 14. Connect MultiGain and SaveWavePCM - Double click on MultiGain to set its parameter. The input signal will be multiplied by the value set in MultiGain's parameter. The default value is 1 (Figure 15.) If you wish to reduce or increase the input signal's power, please change the parameters of this node.
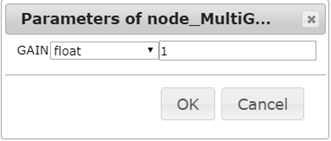
Figure 15. MultiGain parameter
- Right click on SaveWavePCM's output terminal named OUTPUT and select "Set as Output" in the options as shown in Figure 16.
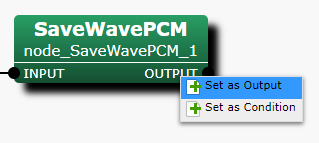
Figure 16. The setting options of OUTPUT - The previous step will prompt a dialog box (Figure 17) for setting the output's name. Default Name is OUTPUT. Click OK.
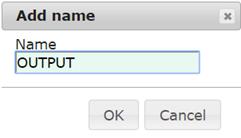
Figure 17. "Add name" Dialog box - Double click on SaveWavePCM. A dialog box will appear. We will be changing BASENAME and BITS parameters. BASENAME indicates the base name of the WAV file that will be saved using this node. Please change it to your preferred value. BITS parameter should match that of the MIC's output bit. Once done click OK.
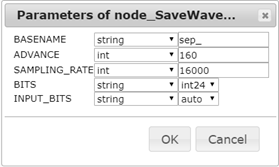
Figure 18. Parameter values set in SaveWavePCM
- Add the following three nodes in the LOOP0 sheet; AudioStreamFromMic, MultiGain and SaveWavePCM. Thess nodes are listed in the Node list or can also be found by typing the node name in the search field located above the node list (Figure 10). To add a node, click
the node once it is displayed in the Node list.
- Click MAIN sheet tab in the HARK Designer as shown in Figure 19.
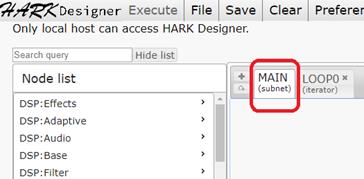
Figure 19. MAIN sheet tab
- Add LOOP0 as a node in the MAIN sheet. To add LOOP0, enter "LOOP0" in the search field to highlight LOOP0 (Figure 20) then click it or select it from Dynamics in the Node List.
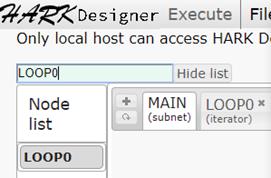
Figure 20. Highlight LOOP0 by typing the name in the search field - Right click on the output terminal OUTPUT of LOOP0 and then select "Set as Output" in the options (Figure 21).
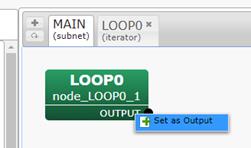
Figure 21. LOOP0 OUTPUT setting options - The dialog box (Figure 22) for setting the name for Output will pop up. Set the name for OUTPUT similar to the name for the output terminal of SaveWavePCM in LOOP0. In this case, use the default value, OUTPUT, and then click OK.
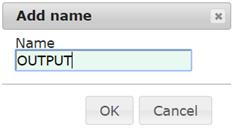
Figure 22. "Add name" Dialog box - MAIN is completed.
- Add LOOP0 as a node in the MAIN sheet. To add LOOP0, enter "LOOP0" in the search field to highlight LOOP0 (Figure 20) then click it or select it from Dynamics in the Node List.
- Click save button at the top part of HARK Designer screen to save the network into a file with preferred filename and click OK (Figure 23). Indicate the .n extension.
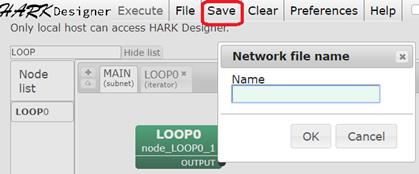
Figure 23. Save button and "Network file name" Dialog box - To load this network, please click on the file button. Search for the network file you wish to load. In this case, we will load the network file we saved in the previous step. Click on file then click on load next to the file name as shown in Figure 24.
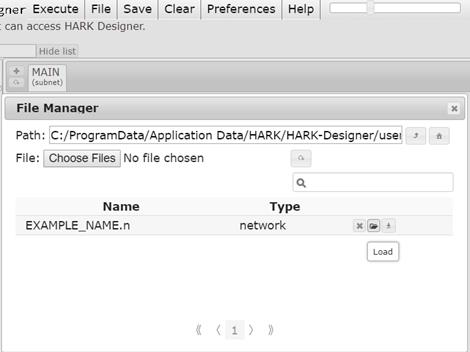
Figure 24. File button and "File Manager" Dialog box
The network file for recording is now ready for execution.
5. Recording Procedure
This section provides detailed procedures focused on recording the TSP signal.
- Connect the devices as illustrated in Figure 2 in Section 2.
- Prepare the recording environment as discussed in Section 3.
- Load the network file we created in Section 4
- Click Execute button at the top part of HARK Designer screen (Figure 25) to run the network file.
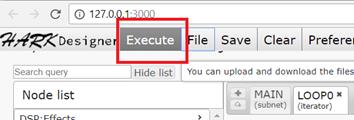
Figure 25. Execute button - Once the network file has been executed, the TSP signal will be played through the speaker.
- Keep the network running until you are able to record the TSP response at least 20 times. In the Transfer Function Generation Manual, it is stated that you should record the TSP response a total of 16 times. In our case, we will raise the minimum to 18. We strongly encourage users to record the TSP response an extra 2 times, which would make our total of 20
- Click Stop button as shown in Figure 26 to stop the network execution.
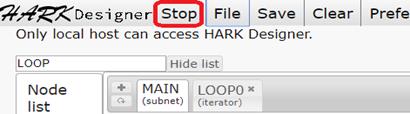
Figure 26. Stop button - Open the output wav file with Audacity. Usually the output files are stored in the same directory where the network file is saved.
- Once you have opened the TSP response, you should see a wave form as shown in Figure 27.
Please note that the TSP response has been considered successfully recorded if the scale of the wave ranges between positive .5 through.05 and negative .5 through .05 as highlighted in Figure 28. If the wave is lower or greater then this values, you can either increase the volume of the loudspeaker or increase the value of MultiGain's parameter.
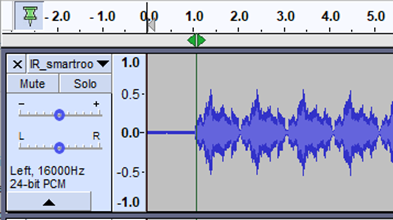
Figure 27. Correctly recorded Sound Wave - If the sound wave is within the specified ranges commented in the previous step please choose at least one channel.
Inspect the channel's audio wave using Audacity Spectrogram viewer. To do this, click on any channel's wave name as shown in Figure 28 and choose the option Spectrogram.
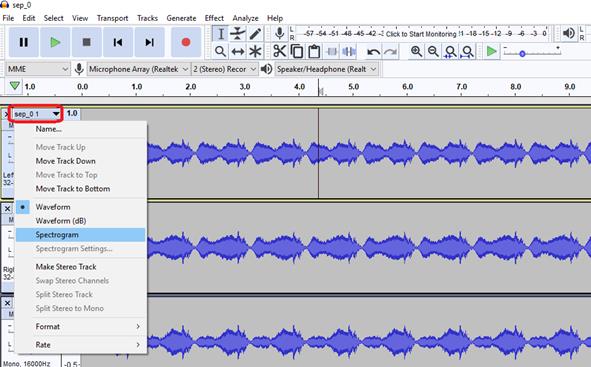
Figure 28. Recorded TSP responses in wave view
Once you have chosen this option, the wave file should look something similar to that of Figure 29.
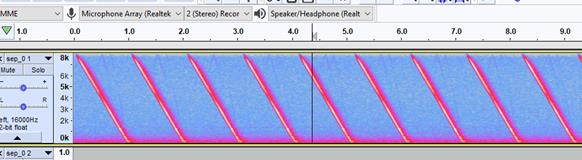
Figure 29. Recorded TSP in spectrogram view - If there are impurities captured like the one enclosed in a black rectangle a shown in Figure 30, redo the recording from Step 5.
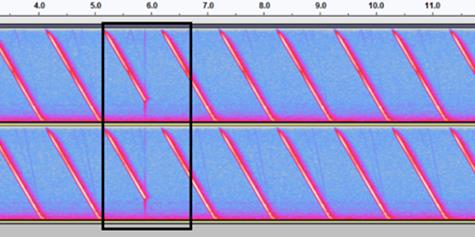
Figure 30. Captured Noise in spectrogram view - If the wave form looks fine, rename the generated wav file with the recording location angle in the filename so it will not get overwritten. Table 1 shows the example filenames corresponding to each recording and angle.
Table 1. Filename ExamplesAzimuth of the speaker where TSP was played in the polar coordinates that were defined in Section 3. Filename 0° sep_000.wav 30° sep_030.wav 60° sep_060.wav ... ... 330° sep_330.wav - Move the speaker to the next marked position in a counter clockwise direction as shown in Figure 31 and do the recording again starting from Step 5 to Step 15. Repeat the recording for all 12 marked angles. There should be 12 successful wav files at the end of this activity.
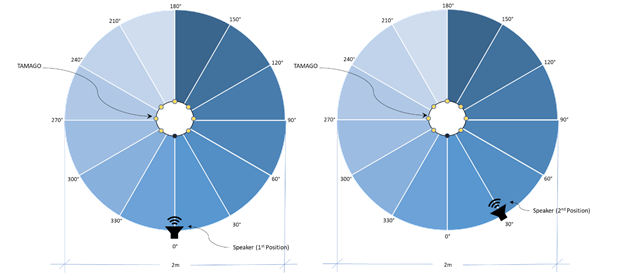
Figure 31. Speaker Positions[Top View]
---- End-----