Generating a Geometric-calculation-based
Transfer Function for TAMAGO Using HARKTOOL5
Table of Contents
1. Overview
2. Creating Microphone Array Positions XML File
3. Creating Sound Source Positions XML File
4. Generating Transfer Function
1. Overview
This manual will focus on how to generate transfer functions using numerical calculation with the geometric relationship between microphones and sound sources which is defined as Geometric-calculation-based method in HARK. In the Geometric-calculation-based method, the impulse responses are simulated from the microphone positions and sound source positions layout. The positions of the microphones in the microphone array will need to be accurately described. In this manual, the positions of the microphones will be assumed based on the design specification of the TAMAGO microphone array. The positions of the sound sources will need to be accurately described as well. For this manual, the positions of the sound sources will be on the circumference of 1-meter radius with the TAMAGO positioned at the center. The positions will be at every 30° central angle interval. The TAMAGO and the all sound source positions will be on the same elevation. Thus, the generated transfer function is for 2D setup. Figure 1 visualizes the positions of the sounds source from the top view.
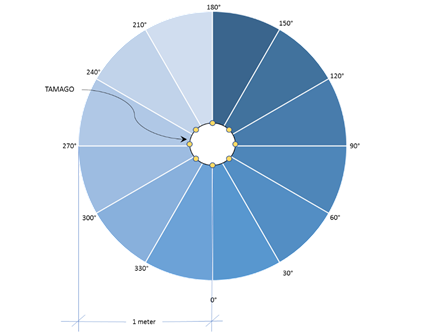
Figure 1. Sound source positions set-up for the manual output [Top View]
2. Creating Microphone Array Positions XML File
- Microphone layout: Circular, 36.5 mm radius (Figure 2)
- Number of channels: 8
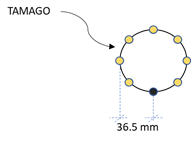
Figure 2. Microphone layout
- Run HARKTOOL5-GUI. See https://www.hark.jp/document/2.4.0/packages/harktool5-gui-en/harktool5-gui.html#id1 on how to run the HARKTOOL5- GUI service.
- Open a web browser (Google Chrome is recommended) and enter http://localhost:3001.
HARKTOOL5-GUI will open as shown in Figure 2.
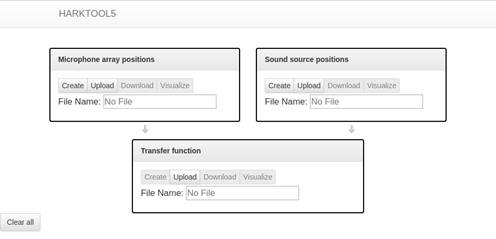
Figure 3. Opened HARKTOOL5-GUI
- Under the microphone array positions panel, click the "Create" button as shown in Figure 4.
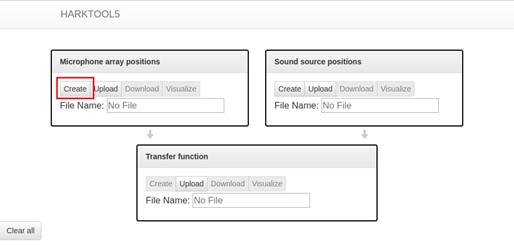
Figure 4. "Create" button for microphone array positions
- In the "Create Microphone Array Positions" page, choose the Circle template (Figure 5). The template selected should match the microphone array design. For the TAMAGO, the shape the microphone array layout is a circle.
Figure 5. Circle template button for microphone array positions
- Leave the value in Output File parameter to its default value "microphones.xml" (Figure 6). This parameter can be edited to use the desired output filename for the microphone array positions xml.
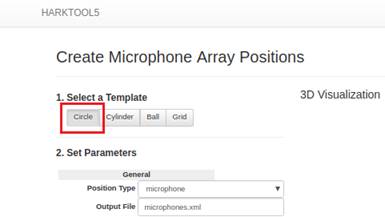
Figure 6. Output File parameter for microphone array positions
- Edit the parameter values under the Radius section (Figure 7) to:
- from = 0.0365
- to = 0.0365
- interval = 0
The parameter values should be adjusted to match the layout of microphones from the microphone array design specification. The "from" and "to" parameter values are measured in meters. For the TAMAGO, the microphones are in a circle with a radius of 36.5 millimeters (0.0365 meters).
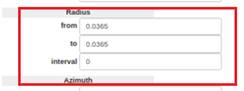
Figure 7. Radius section for microphone array positions
- Edit the parameter values under the Azimuth section (Figure 8) to:
- from = 0
- to = 359
- interval = 45
The parameter values should be adjusted to match the layout of microphones from the microphone array design. For the TAMAGO, there are 8 microphones in a circle with an interval of 45°
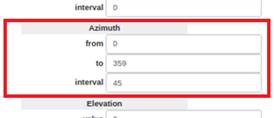
Figure 8. Azimuth section for microphone array positionss
- Edit the parameter values under the Elevation section (Figure 9) to:
- value = 0
The parameter values should be adjusted to match the layout of microphones from the microphone array design. For the TAMAGO, the microphones are all in the same elevation.

Figure 9. Elevation section for microphone array positions
- Leave the other parameters in their default values. Figure 10 shows the values of the parameters after setting for steps 5 - 8.
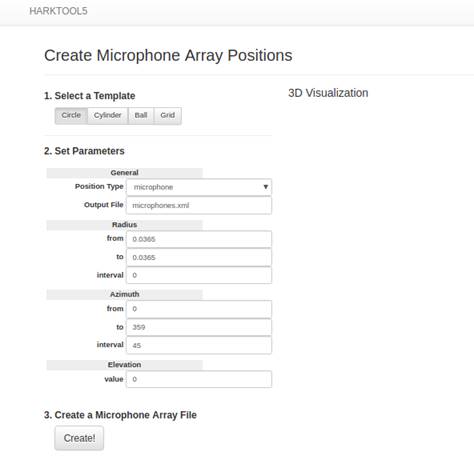
Figure 10. Values for the microphone array positions parameters
- Click the "Create!" Button (Figure 11) near the bottom of the page.
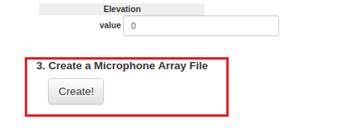
Figure 11. "Create!" button for microphone array positions
- After a successful generation, check the 3D Visualization on the right side of the page. Figure 12 shows the expected output for the 3D visualization using the parameters values shown in Figure 10. If the visualization shows the correct positions and number of microphones (represented by red dots), click the link bordered in green found at the bottom part to go back to the top page.
Figure 12. 3D Visualization output of the microphone array positions and link to return the top page
- In the top page, the filename of the successfully generated microphone array positions xml should be displayed in the File Name text box under the microphone array positions panel (Figure 13).
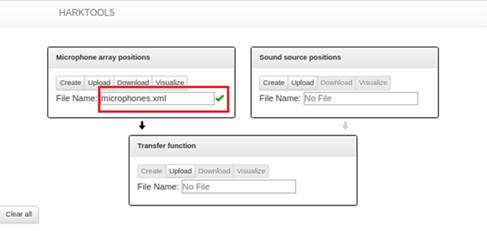
Figure 13. Filename of successfully generated microphone array positions in the top page
- To see the visualization or modify the values of the generated microphone array positions xml, click the "Visualize" button (Figure 14).
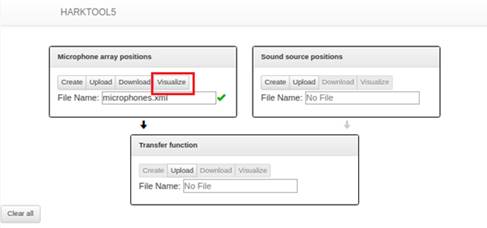
Figure 14. "Visualize" button for microphone array positions
- In the visualize page (Figure 15), check if the number and positions of microphones are as expected.
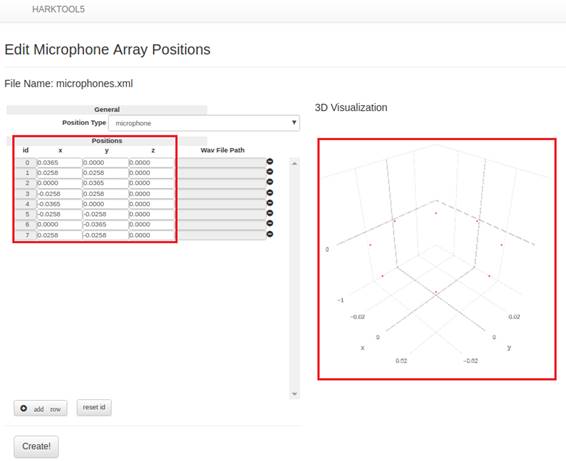
Figure 15. Positions parameter values and 3D visualization in microphone array positions visualize page
- Edit the values as needed. If the values are edited, click the "Create!" button to apply the changes made.
- If the positions are not correct, go back to the top page.
- The generated microphone array positions xml can be downloaded. To do this, click the "Download" button (Figure 16) in the microphone array positions panel. The downloaded microphone array positions xml can be used to upload the same configuration instead of creating the same microphone array positions xml again.

Figure 16. "Download" and "Upload" button for microphone array positions
- Number of sound source positions: 12
- Layout: Circular with a 1-meter radius
- Elevation to the microphone positions: 0°
- Open the HARKTOOL5-GUI. Please refer to steps 1 and 2 of 2. Creating Microphone Array Positions XML File.
- Under the sound source positions panel, click the "Create" button (Figure 17).
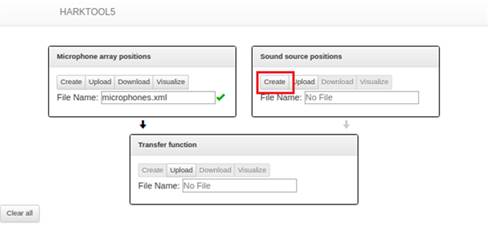
Figure 17. "Create" button for sound source positions
- Select the Circle template (Figure 18) for the sound source positions. The template should match the layout for the microphone array positions set-up. The layout is circular, so the Circle template is chosen.
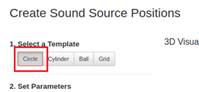
Figure 18. Circle template button for sound source positions
- Leave the value for the Position Type parameter to the default "tsp" (Figure 19).
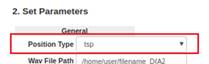
Figure 19. Position Type parameter
- Leave the value for the "Wav File Path" parameter to the default /home/user/filename_D{AZIMUTH:%03.1f}_E{ELEVATION:%03.1f}_R{RADIUS:%03.1f}.wav (Figure 20). For geometric calculation-based method there are no wav files, so the parameter value for the path to the wav file location is not used.
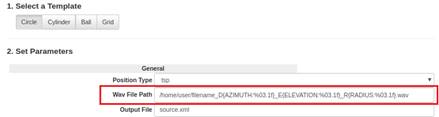
Figure 20. Wav File Path parameter
- Leave the value for the Output File parameter to the default "source.xml" (Figure 21). The parameter value can be edited to use the desired output filename for the sound source positions xml.
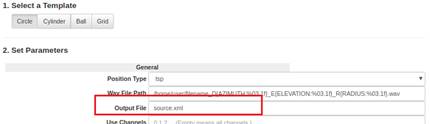
Figure 21. Output File parameter for sound source positions
- Edit the values of the parameters in the Radius, Azimuth and Elevation sections to:
- Radius Section: from = 1, to = 1 and Interval = 0
- Azimuth Section: from = 0, to = 359 and Interval = 30
- Elevation Section: value = 0
- The position parameters should match the layout for the sound source positions set-up. The values above match the set-up:
- Layout: Circular with a 1-meter radius
- Number of sound source positions: 12
- Elevation to the microphone positions: 0°
- Figure 22 shows the values for the parameters in the Radius, Azimuth and Elevation sections.
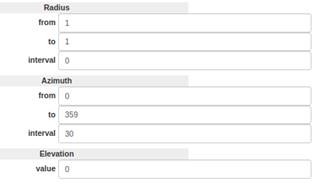
Figure 22. Values for the parameters in the Radius, Azimuth and Elevation sections
- Leave the values of the other parameters to their default values and click the "Create!" Button (Figure 23) at the bottom of the sound source positions page.
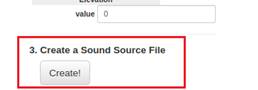
Figure 23. "Create!" button for sound source positions
- AAfter a successful generation, check the 3D Visualization on the right side of the page. Figure 24 shows the expected output for the 3D visualization using the parameters values set in steps 3 - 7. If the visualization shows the correct positions and number of sound sources (represented by red dots), click the link bordered in green found near the bottom part of the page to go back to the top page.
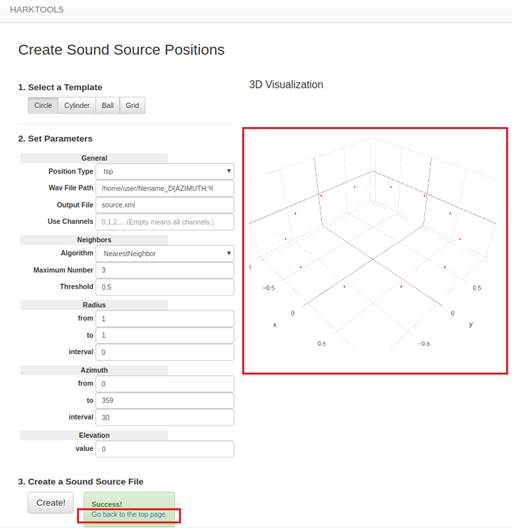
Figure 24. 3D Visualization output of the sound source positions and link to return the top page
- In the top page, the filename of the successfully generated sound source positions xml should be displayed in the File Name text box under the sound source positions panel (Figure 25).
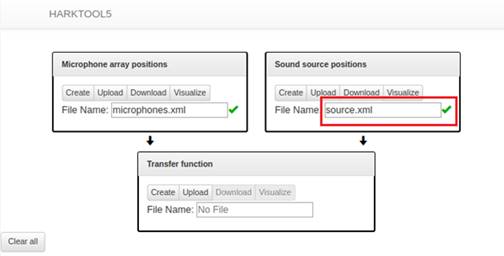
Figure 25. Filename of successfully generated sound source positions xml in the top page
- Under the sound source positions panel, click the "Visualize" button (Figure 26).
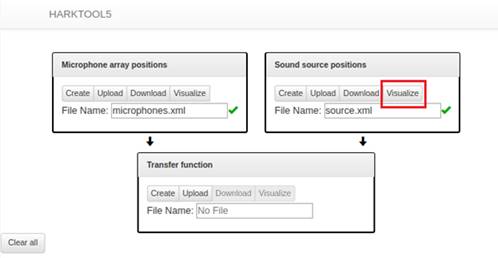
Figure 26. "Visualize" button for sound source positions
- In the visualize page (Figure 27), check if the sound source positions are as expected. For geometric calculation-based method, the values for Wav File Path parameters are not used, so they do not need to be checked.
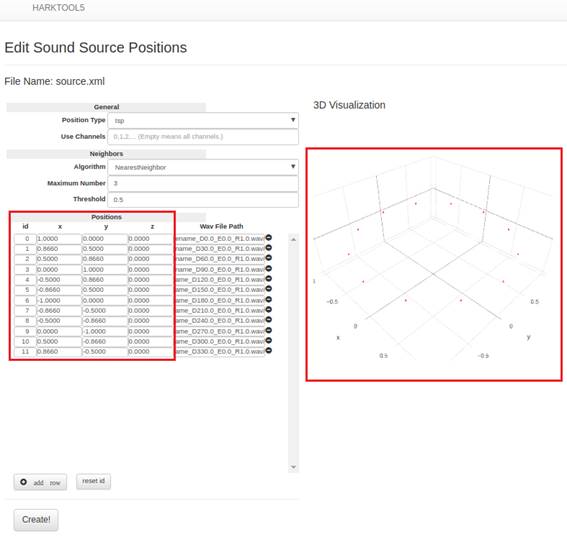
Figure 27. Positions parameter values and 3D visualization in sound source positions visualize page
- Edit the values as needed. If the values are edited, click the "Create!" button to apply the changes made.
- If the positions and filenames are not correct, go back to the top page.
- The generated sound source positions xml can be downloaded. To do this, click the "Download" button (Figure 28) in the sound source positions panel. The downloaded sound source positions xml can be used to upload the same configuration instead of creating the same sound source positions xml again.
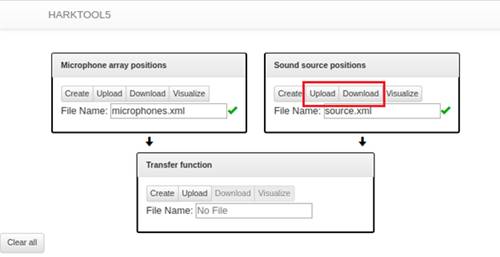
Figure 28. "Download" and "Upload" button for sound source positions
- Open the HARKTOOL5-GUI. Please refer to steps 1 and 2 of 2. Creating Microphone Array Positions XML File.
- Prepare the microphone array positions xml file and the sound source positions xml file. If the two files are ready for transfer function generation, the panels for microphone array positions and sound source positions should show a check mark as shown in Figure 29. If the files are not ready, use the steps in Section 2 or Section 3 to prepare the files. The files can also be uploaded if the files were previously downloaded as shown in Figure 16 and Figure 28.
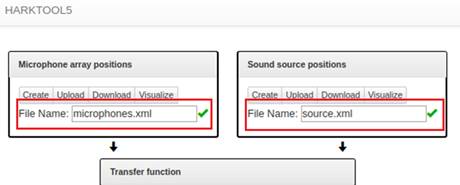
Figure 29. Microphone array positions xml file and sound source positions xml file ready for transfer function generation, as indicated by the check marks
- With the microphone array positions xml file and the sound source positions xml file ready, click the "Create" button (Figure 30) under the transfer function panel.
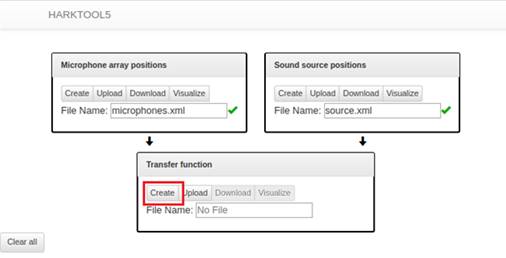
Figure 30. "Create" button for transfer function
- Leave the values for the Config (General Parameters) to their default values. The default values are shown in Figure 31. A short description of each parameter is available in .
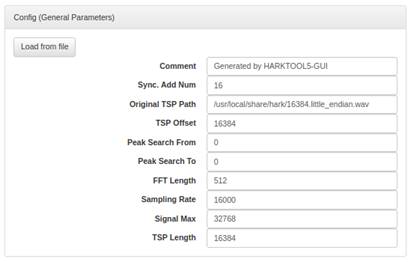
Figure 31. Default values for Config (General Parameters)
- Leave the value for the Output File Name (zip) parameter to the default value "tf.zip" (Figure 32). The parameter value can be edited to use the desired output filename for the transfer function zip file.
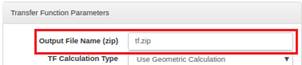
Figure 32. Output File Name (zip) parameter
- Select the "Use Geometric Calculation" for the TF Calculation Type (Figure 33). The value for TF Calculation Type will depend on the algorithm and wav files to be used. For geometric calculation-based transfer functions, it will be "Use Geometric Calculation". A short description of each option is available in https://www.hark.jp/document/2.4.0/packages/harktool5-gui-en/harktool5-gui.html#create-tf-label.
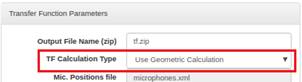
Figure 33. Use Geometric Calculation" selected in TF Calculation Type
- Leave the other values for the parameters in the Transfer Function Parameters section to their default values. The default values of the other parameters are shown in Figure 34.
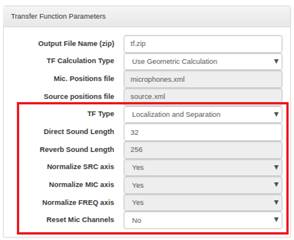
Figure 34. Default value for the other Transfer Function Parameters
- Click the "Create!" Button (Figure 35) found near the bottom left part of the page.
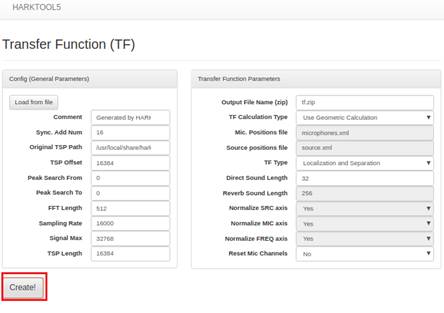
Figure 35."Create!" Button for transfer function
- The status of the transfer function generation will be displayed in the bottom part. Figure 36 shows how a successful status for the transfer function generation will look like.
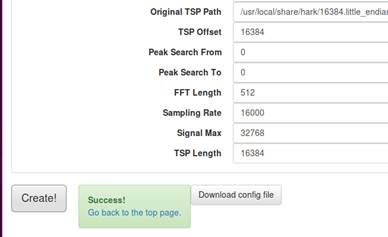
Figure 36. Successful status in transfer function generation
- Once successful with the creation, the Localization and Separation transfer function will be generated and packaged in a zip file. Click the link bordered in green (Figure 37) found near the bottom part of the page to go back to the top page.
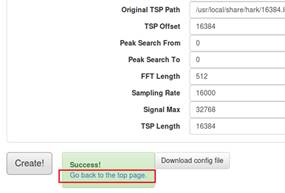
Figure 37. Link to return the top page for transfer function
- In the top page, the successfully generated localization and separation transfer functions zip file should be displayed in the File Name text box under the transfer function panel (Figure 38).
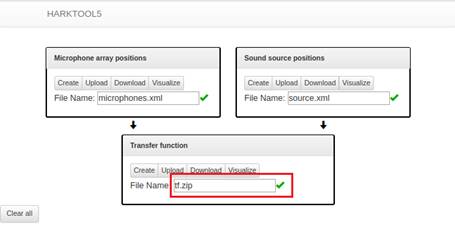
Figure 38. Filename of successfully generated transfer function zip file in the top page
- The created transfer function file can be confirmed in 3D graph by clicking the "Visualize" button (Figure 39) under the transfer function panel.
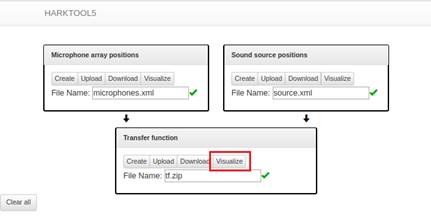
Figure 39. "Visualize" button for transfer function
- The TF visualize feature can graph either the Localization transfer function or Separation transfer function. To confirm the Localization transfer function, set TF type to "Localization", set Domain to "Time domain" and set Z Axis to "Amplitude" as shown in Figure 40.
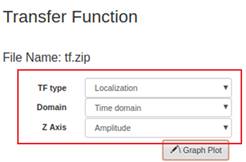
Figure 40. Parameter values for TF Type, Domain and Z Axis to confirm the Localization transfer function
- Click the "Graph Plot" button (Figure 41). For the sound source positions configured in Section 3, the Time domain graph of the Localization transfer function with Amplitude as the Z-axis should look something like the graph in Figure 41.
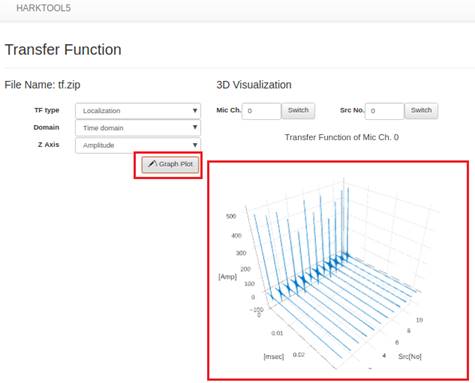
Figure 41. Graph Plot button and time domain graph for the generated localization transfer function with amplitude as the z-axis
- To confirm the Separation transfer function, set TF type to "Separation", set Domain to "Time domain" and set Z Axis to "Amplitude" as shown in Figure 42.
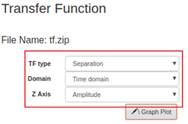
Figure 42. Parameter values for TF Type, Domain and Z Axis to confirm the Separation transfer function
- Click the "Graph Plot" button (Figure 43). For the sound source positions configured in Section 3, the Time domain graph of the Separation transfer function with Amplitude as the Z-axis should look something like the graph in Figure 43.
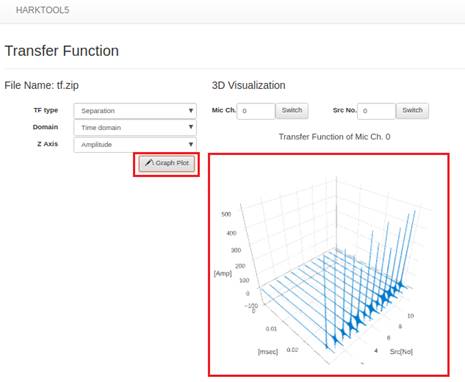
Figure 43. "Graph Plot" button and time domain graph for the generated separation transfer function with amplitude as the z-axis
- To download the generated transfer function, click Download on the transfer function panel shown in Figure 44. The downloaded transfer function can be used in HARK Designer for sound source localization or sound source separation.
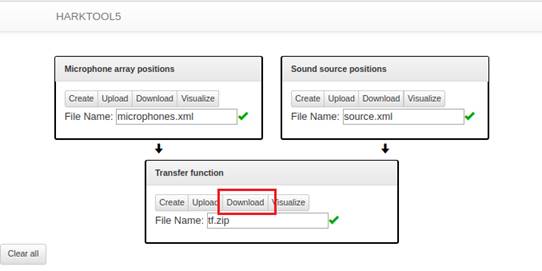
Figure 44. "Download" button for transfer function
3. Creating Sound Source Positions XML File
Please refer to Figure 1 for the sound source positions set-up.
4. Generating Transfer Function
---- End-----